Lab 3: WiFi, Wireshark, and CSI Collection IoT
Date: July 8
Time: 1:00-5:00 PM
TA: Shanmu Wang
Hardware: three ESP32 boards per group: softAP, injector, and sniffer
Goals
By the end of this lab, each group should be able to:
- explain WiFi frames, channels, RSSI (received signal strength indicator), OFDM subcarriers, and channel state information (CSI);
- optionally use Wireshark to inspect a captured WiFi packet trace;
- flash or verify three ESP32 firmware roles: access point, frame injector, and CSI sniffer;
- identify and record ESP32 serial ports, MAC addresses, and WiFi channels;
- visualize CSI amplitude over time and across subcarriers;
- implement a simple variance-based CSI motion detector;
- explain why WiFi sensing depends on multipath, geometry, motion, and interference.
Lab Code
Use the WiFi lab repository for the firmware projects, Python tools, and example packet capture:
https://github.com/wshanmu/wifi_lab
Clone it once:
git clone https://github.com/wshanmu/wifi_lab.git
cd wifi_lab
Before lab, update to the latest version:
git pull
The main folders are:
| Path | Purpose |
|---|---|
softAP/ |
ESP-IDF firmware for the ESP32 access point. |
injector/ |
ESP-IDF firmware that transmits spoofed WiFi frames as the CSI stimulus. |
sniffer/ |
ESP-IDF firmware that listens for the injector frames and streams CSI over USB serial. |
tools/ |
Python live CSI plot and presence-detection tools. |
wireshark_example.pcap |
Example WiFi packet capture for the Wireshark demo. |
System Overview
The lab uses three ESP32 roles.
softAP creates WiFi link context
injector sends spoofed 802.11 frames
sniffer captures CSI from those frames and streams it over USB serial
CSI is richer than RSSI. RSSI is one received-power number. CSI gives amplitude and phase information for many OFDM subcarriers, so it changes when people move and alter the multipath reflections in the room.
Hardware and Board Roles
Each group will use three ESP32-based boards. An ESP32 is a WiFi/Bluetooth microcontroller. A microcontroller, or MCU, is a small computer designed to run firmware directly, control hardware pins, talk to sensors, and react to events in real time.
| Role | Board | ESP-IDF target | Purpose |
|---|---|---|---|
softAP |
M5Stack Core2 ESP32 IoT Development Kit | esp32 |
Creates the WiFi access point and fixes the channel used by the lab. |
sniffer |
ESP32-CAM | esp32 |
Captures packets in promiscuous mode and streams CSI over USB serial. |
injector |
ESP32-C3-Mini | esp32c3 |
Sends repeated 802.11 frames that create a controllable CSI signal source. |
Use the ESP32-CAM as the sniffer unless a TA tells you otherwise. The current sniffer firmware and CSI data path are tested on the classic ESP32 target, not on the ESP32-C3-Mini.
Group and Shared Log
Form groups of three. A Windows laptop is not required for this lab.
Use the shared Google Sheet to record:
- group name and member names;
- assigned board roles and serial ports;
- SoftAP MAC address and WiFi channel;
- injector fake MAC address;
- experiment notes and final short-report link.
After groups are formed, the TA will distribute one kit per group: one softAP board, one injector board, one sniffer board, and the needed USB cables.
Before You Start
Each group should have one kit with:
- one M5Stack Core2 ESP32 IoT Development Kit as the
softAP; - one ESP32-C3-Mini as the
injector; - one ESP32-CAM as the
sniffer; - USB data cables, not charge-only cables;
- at least one laptop with VS Code installed;
- the
cosmos-dsConda environment from Lab 1; - the WiFi lab repository cloned locally.
If the boards are already pre-flashed by the TA, still read the firmware steps so you understand what each board is doing. You may only need to verify the serial output.
ESP-IDF Setup
ESP-IDF is Espressif’s official toolchain for building, flashing, and monitoring ESP32 firmware. Set it up in this lab; the same setup will also be useful for the July 9 IMU lab.
- Install or update Visual Studio Code.
- In VS Code, install the official ESP-IDF extension.
- Open the command palette:
- macOS:
Command+Shift+P - Windows/Linux:
Ctrl+Shift+P
- macOS:
- Run
ESP-IDF: Open ESP-IDF Installation Manager. - Install ESP-IDF and its tools using the installer: Select the easy installation and latest version (v6.0.2)
- Run
ESP-IDF: Select Current ESP-IDF Version. - Run
ESP-IDF: Doctor Commandand fix any reported setup issues.
Verify ESP-IDF With Hello World
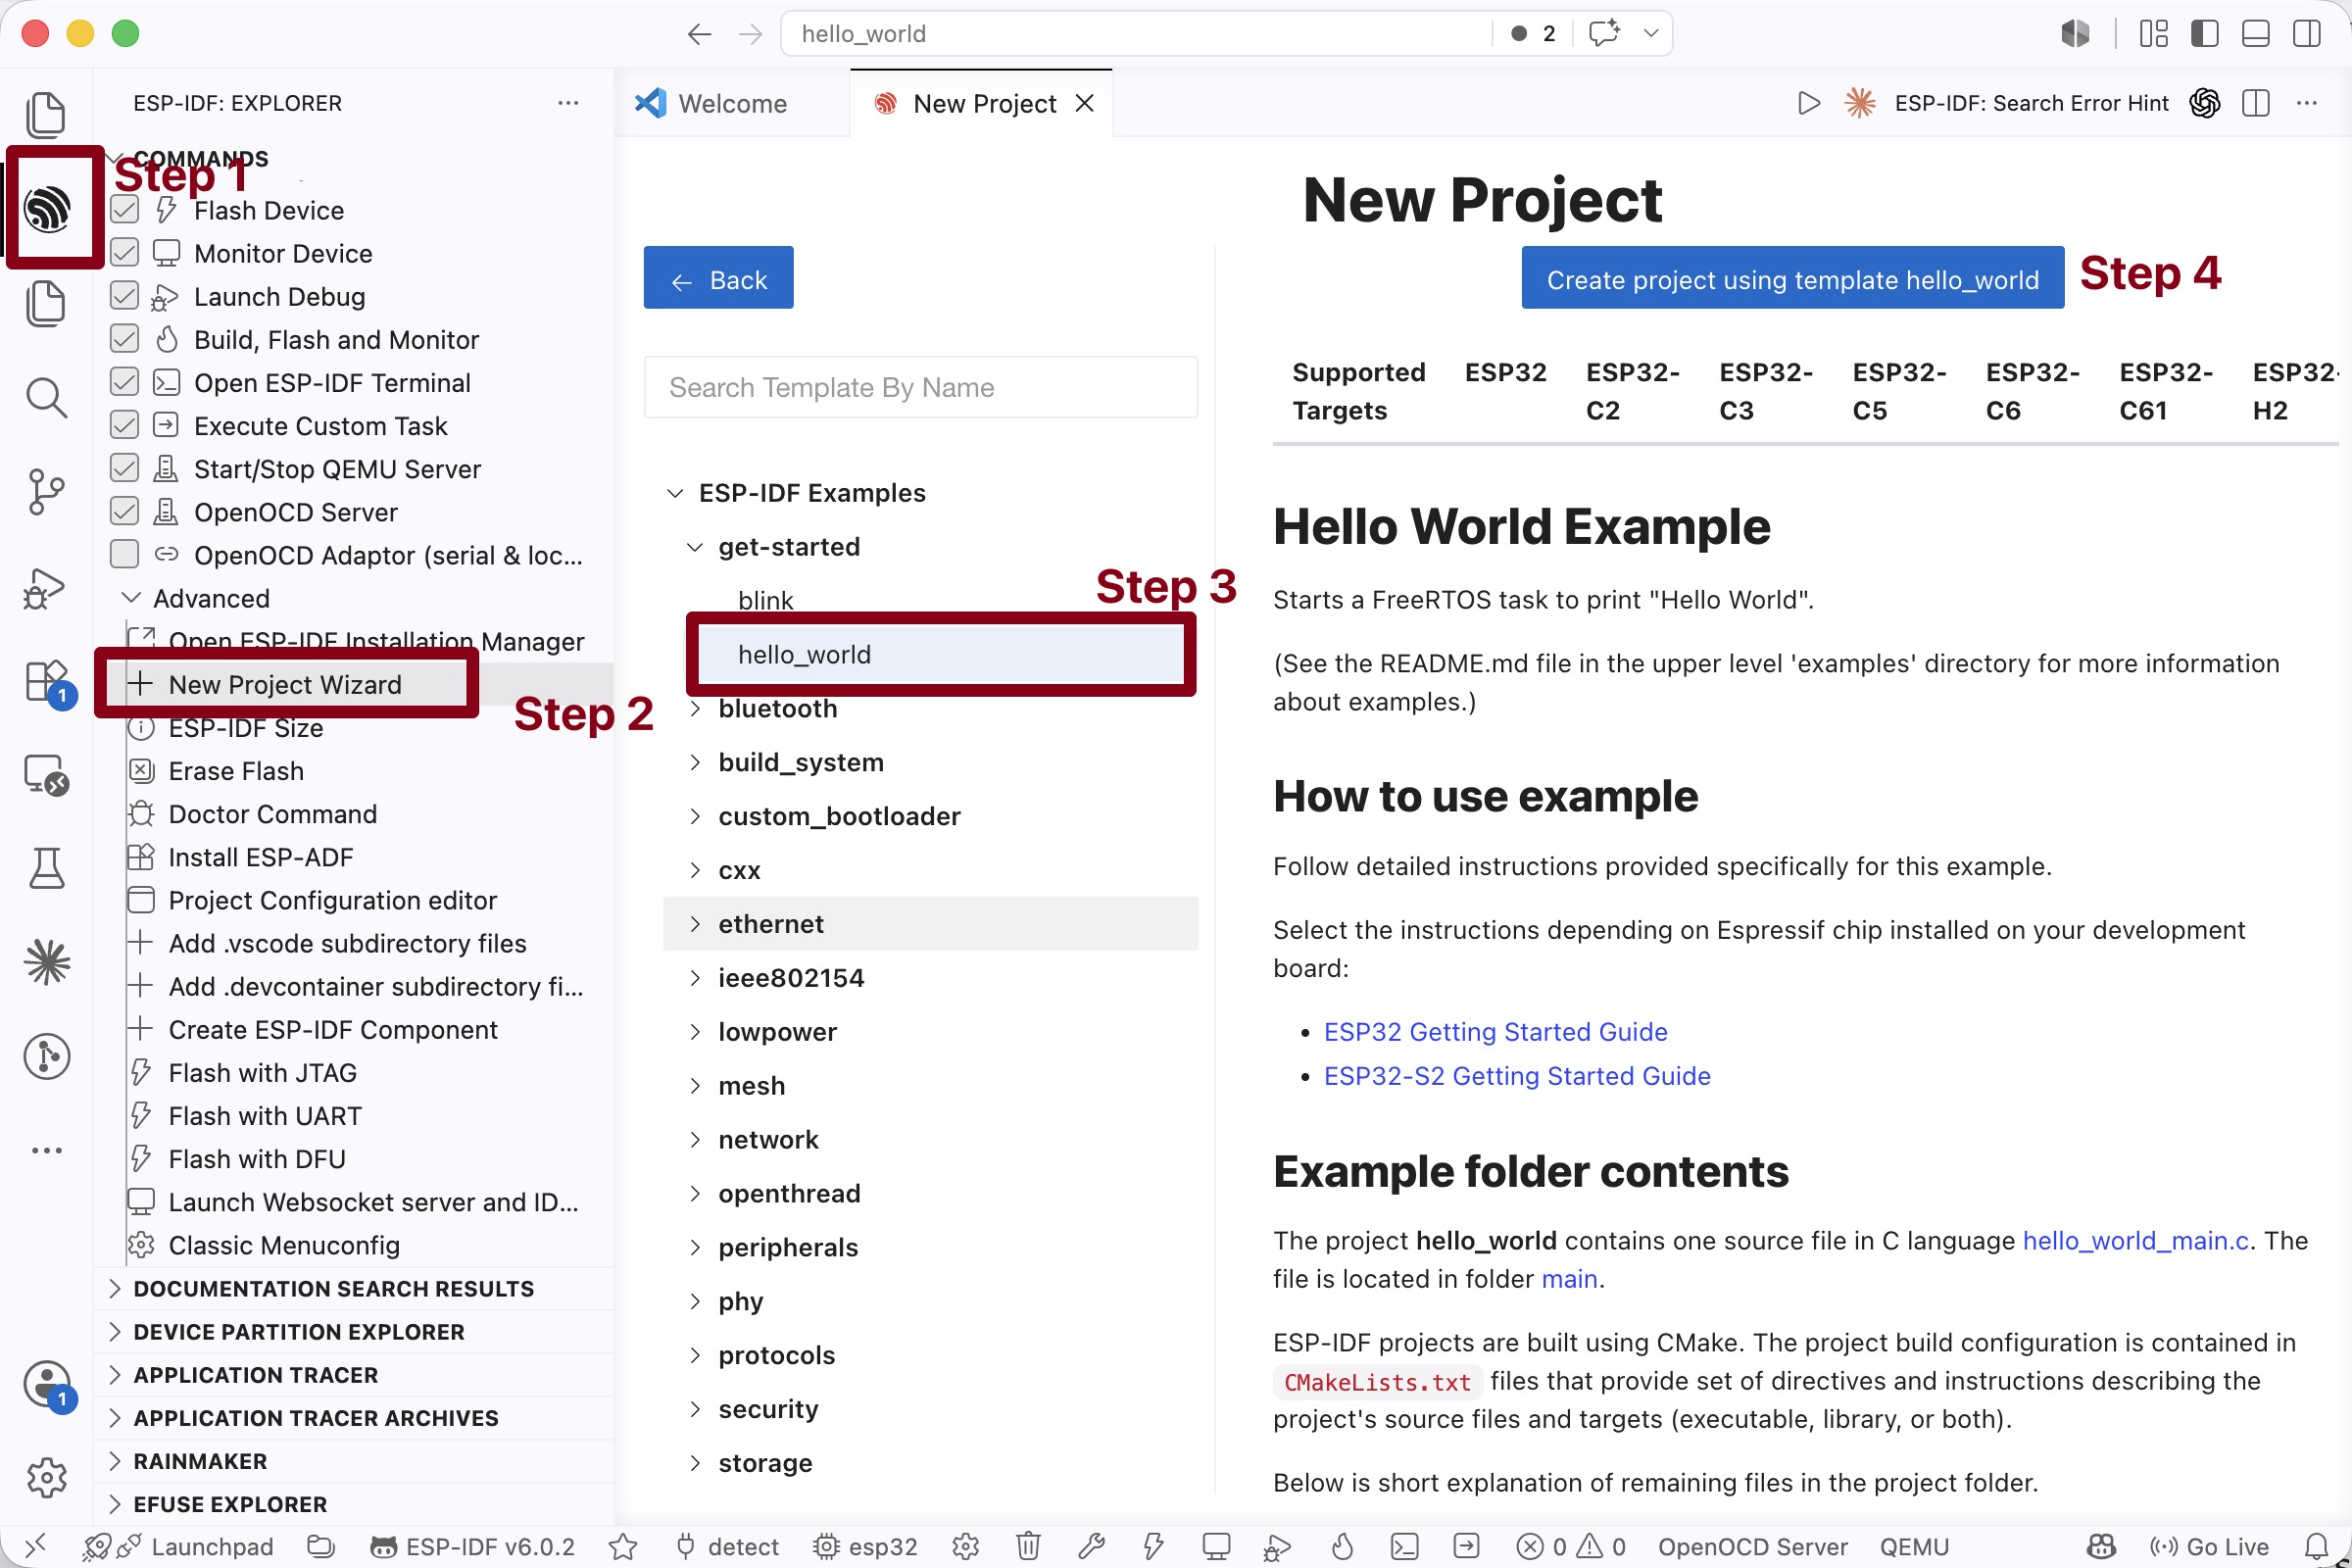
Before flashing the WiFi lab firmware, verify the full build, flash, and monitor pipeline with ESP-IDF’s hello_world example.
- Open the VS Code command palette.
- Run
ESP-IDF: New Project. - Choose the
hello_worldexample project. - Save it outside the
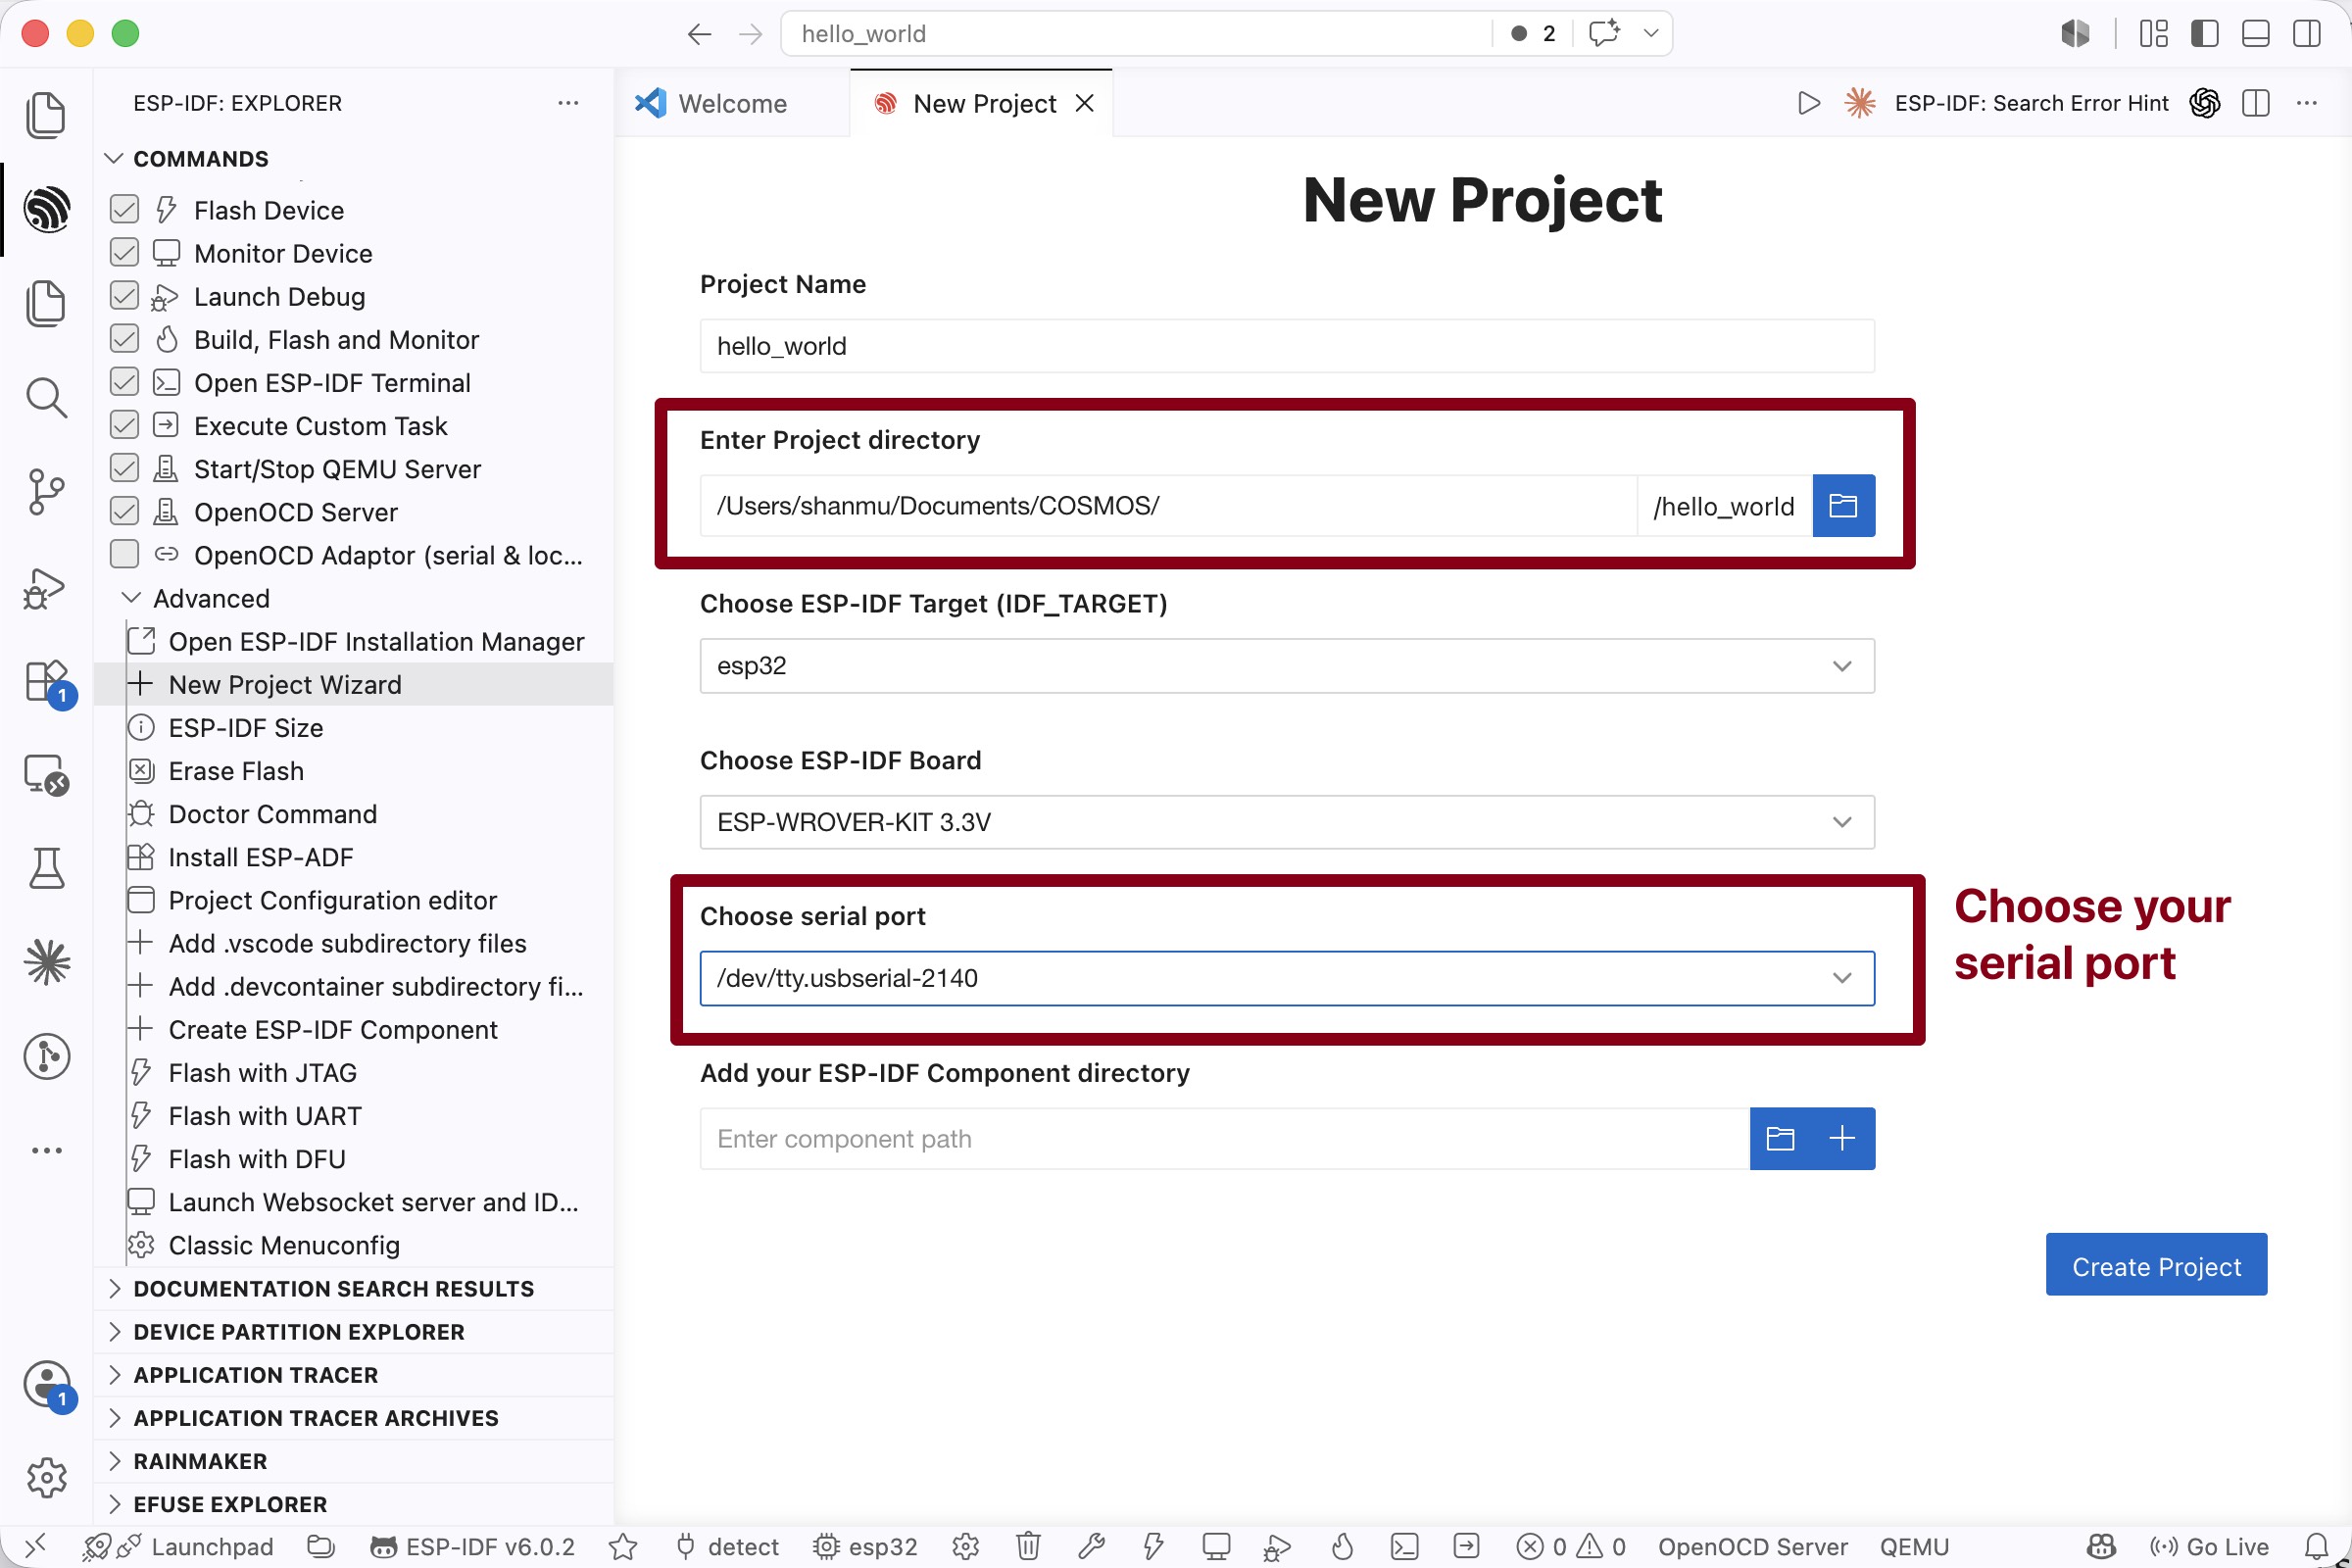
wifi_labrepository, for example in a temporaryesp-idf-testfolder. - Select the target:
- use
esp32if testing the M5Stack Core2 or ESP32-CAM; - use
esp32c3if testing the ESP32-C3-Mini.
- use
- Select the serial port for the connected board.
- When flashing, use UART as the flashing method.
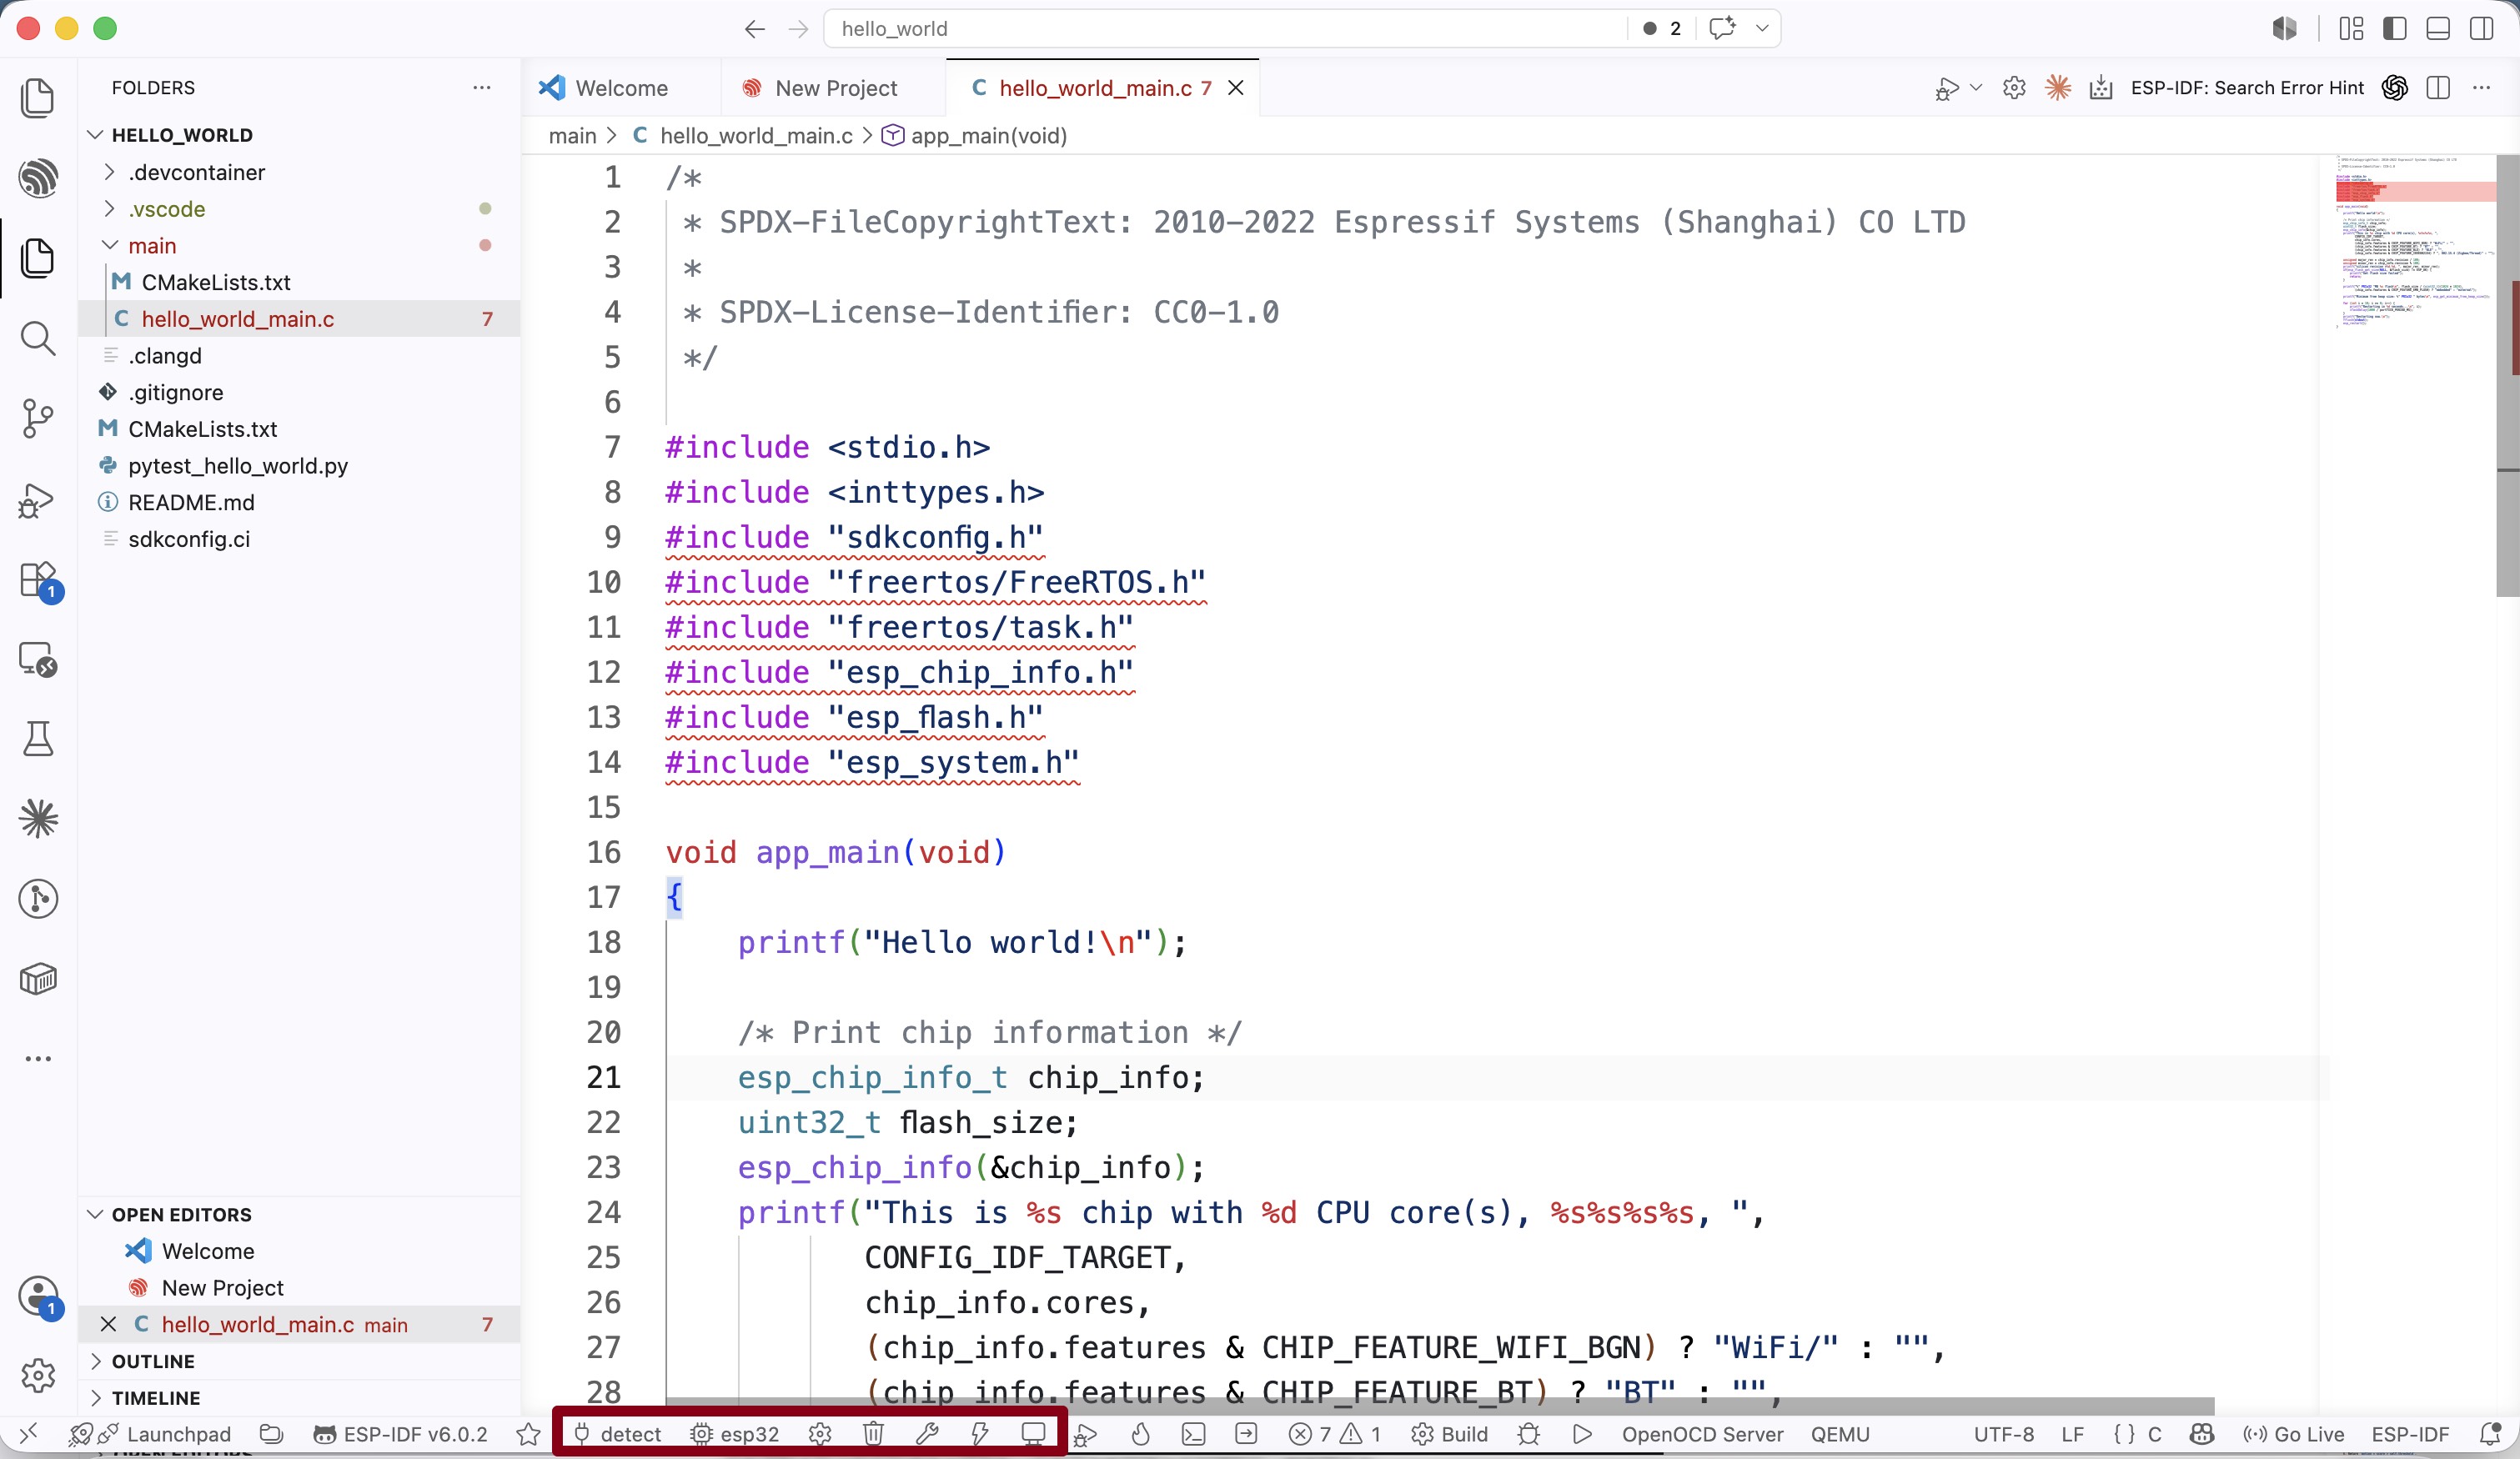
- Run
ESP-IDF: Build, Flash and Start a Monitor on Your Device.
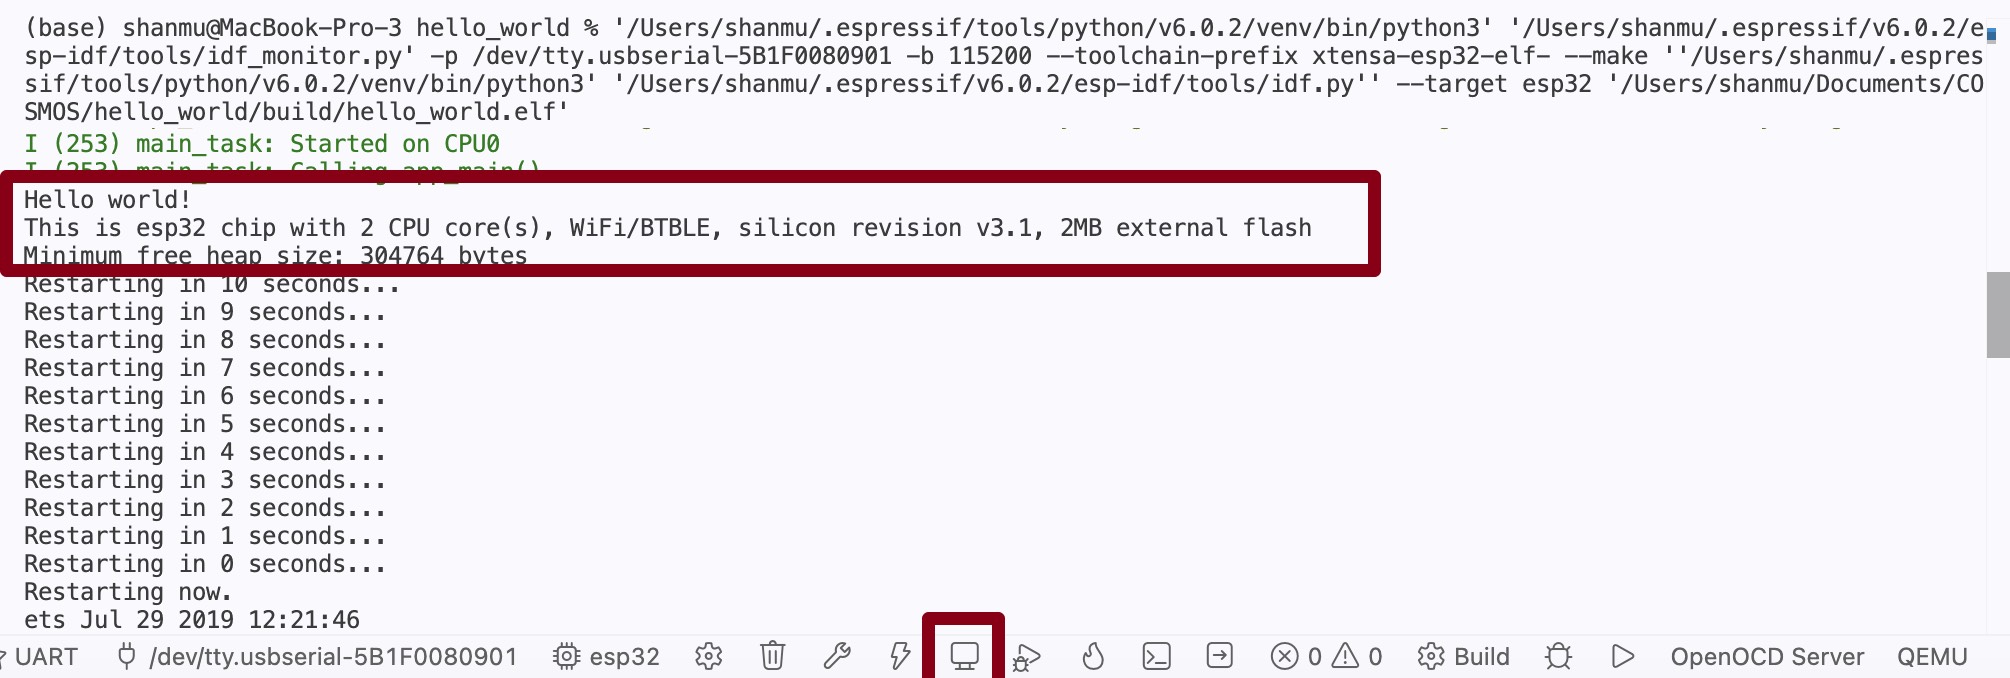
The monitor should show the hello_world output and then restart countdown messages.
Fix VS Code #include errors detected Warning for ESP-IDF
Sometimes VS Code shows this warning:
#include errors detected. Please update your includePath.
Squiggles are disabled for this translation unit.
If your firmware still builds successfully, this is usually not a code error. It usually means VS Code IntelliSense does not know the correct ESP-IDF include paths yet.
Step 1: Build the Firmware Once
Open the project folder in VS Code and build it once. After the build finishes, the project should contain:
build/compile_commands.json
This file tells VS Code the correct include paths and compiler flags for the current ESP-IDF project.
Step 2: Open VS Code Settings JSON
Open the VS Code command palette:
Ctrl + Shift + P
On macOS, use:
Cmd + Shift + P
Search for:
Preferences: Open Workspace Settings (JSON)
If that is not available, use:
Preferences: Open User Settings (JSON)
Workspace settings are preferred because they apply only to this project.
Step 3: Add the Correct Settings
For Windows, add:
{
  "C_Cpp.default.compileCommands": "${workspaceFolder}/build/compile_commands.json",
  "C_Cpp.default.intelliSenseMode": "windows-gcc-x64"
}
For macOS with Apple Silicon, add:
{
  "C_Cpp.default.compileCommands": "${workspaceFolder}/build/compile_commands.json",
  "C_Cpp.default.intelliSenseMode": "macos-clang-arm64"
}
For macOS with an Intel chip, add:
{
  "C_Cpp.default.compileCommands": "${workspaceFolder}/build/compile_commands.json",
  "C_Cpp.default.intelliSenseMode": "macos-clang-x64"
}
For Linux, add:
{
  "C_Cpp.default.compileCommands": "${workspaceFolder}/build/compile_commands.json",
  "C_Cpp.default.intelliSenseMode": "linux-gcc-x64"
}
Step 4: Reload VS Code
After saving settings.json, reload VS Code from the command palette:
Developer: Reload Window
The warning should disappear. You should also be able to jump into ESP-IDF APIs: use Ctrl + click or right-click on Windows/Linux, or Cmd + click on macOS, on a function such as esp_wifi_set_channel to inspect the implementation and API usage.
When flashing a board, open that board’s firmware folder in VS Code and select the correct target:
| Folder | Board role | Target |
|---|---|---|
softAP/ |
M5Stack Core2 SoftAP | esp32 |
injector/ |
ESP32-C3-Mini injector | esp32c3 |
sniffer/ |
ESP32-CAM sniffer | esp32 |
Do not erase flash or overwrite code outside the lab repository unless a TA asks you to.
Official references:
- ESP-IDF Extension for VS Code installation guide
- ESP-IDF Get Started guide for ESP32
- ESP-IDF Get Started guide for ESP32-C3
Python Tool Setup
Open a terminal in the repository:
cd wifi_lab
Activate the Conda environment from Lab 1 and install the WiFi lab packages:
conda activate cosmos-ds
python -m pip install -r tools/requirements.txt
Check the plotting tool without hardware:
python tools/plot_csi_serial.py --demo-signal
A window titled ESP32 CSI Live Amplitude should open.
Find Serial Ports
Use your actual serial port in later commands.
macOS:
ls /dev/cu.* 2>/dev/null
Linux:
ls /dev/ttyUSB* /dev/ttyACM* 2>/dev/null
Windows:
Open Device Manager -> Ports (COM & LPT), then look for the new COM port.
Useful examples:
- macOS:
/dev/cu.usbserial-5B1F0080901 - Linux:
/dev/ttyUSB0 - Windows:
COM5
In VS Code, the ESP-IDF status bar also shows the selected serial port and target. Confirm these before flashing.

Four-Hour Plan
1:00-1:10 PM - Goals and Repository Clone
The TA will first explain the lab goals, the final expected result, and the three ESP32 roles.
Then clone the lab repository:
git clone https://github.com/wshanmu/wifi_lab.git
cd wifi_lab
If you already cloned the repository, update it:
git pull
1:10-1:25 PM - Groups and Kit Distribution
Form groups of three. Add your group information to the shared Google Sheet.
Each group will receive one kit:
- one
softAPboard; - one
injectorboard; - one
snifferboard; - USB data cables.
Before moving on, record your group name and member names in the shared sheet.
1:25-2:15 PM - Guided ESP-IDF Setup and Hello World Flash
The TA will walk through ESP-IDF setup step by step. Each group should confirm:
- VS Code can see the ESP-IDF extension commands.
- ESP-IDF Doctor reports a usable installation.
- One board can build, flash, and monitor the
hello_worldexample. - The serial monitor shows readable
hello_worldoutput.
Use the hello-world verification steps above before flashing the WiFi lab firmware. This confirms that the USB cable, driver, ESP-IDF target, flash method, and serial monitor are working.
2:15-2:45 PM - Slides, Wireshark Demo, and Expected Result
The TA will use slides to introduce:
- WiFi frame: one structured packet on the wireless link.
- Channel: the frequency slice the radio uses, such as 2.4 GHz channel 1.
- OFDM subcarrier: a narrow frequency bin inside the WiFi channel.
- RSSI: one scalar received signal strength value.
- CSI: per-subcarrier channel response. We will use CSI amplitude for sensing.
- Multipath: reflected signal paths from walls, furniture, and people.
Key idea: when a person moves near the injector-sniffer link, the wireless channel changes. That motion can show up as higher CSI variance.
The TA will also show a Wireshark demo and the expected end-to-end result:
- SoftAP is visible as a WiFi network.
- Injector prints
Starting injection.... - Sniffer prints CSI lines with timestamp, RSSI, MAC address, and CSI values.
- The Python plot shows a live CSI heatmap.
- The motion detector score increases when someone moves near the link.
To inspect the provided example capture yourself, install Wireshark, then open:
wireshark wireshark_example.pcap
If that command does not work, open Wireshark first and use File > Open.
Find one beacon or data frame and inspect:
- frame type;
- source MAC address;
- destination MAC address;
- sequence number;
- channel or radio metadata if available.
Optional live capture: on Linux, with a compatible WiFi adapter and permission to monitor the local lab channel, you can run:
sudo ./wifi_monitor_capture.sh wlan0 1
Replace wlan0 and 1 with your wireless interface and lab channel. Only capture traffic on networks and spectrum you are authorized to monitor.
2:45-3:15 PM - Configure or Verify the SoftAP Board
The SoftAP board creates the WiFi network context for the link.
- Open the
softAP/folder in VS Code. - Connect the board labeled
softAP. - Identify its serial port.
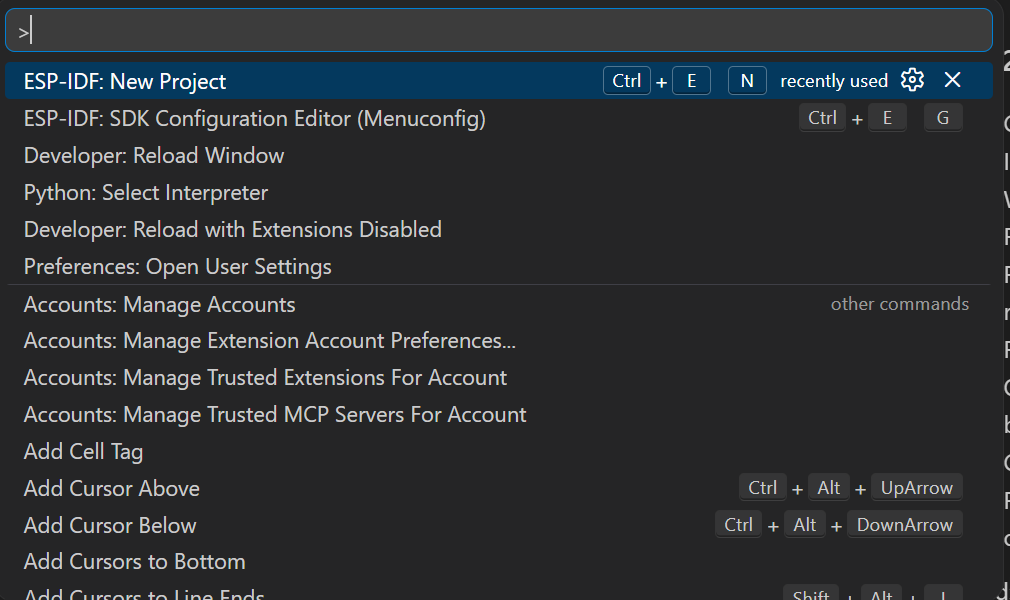
- Open the ESP-IDF Command Palette with
Ctrl+Shift+PorCommand+Shift+P.
- Open
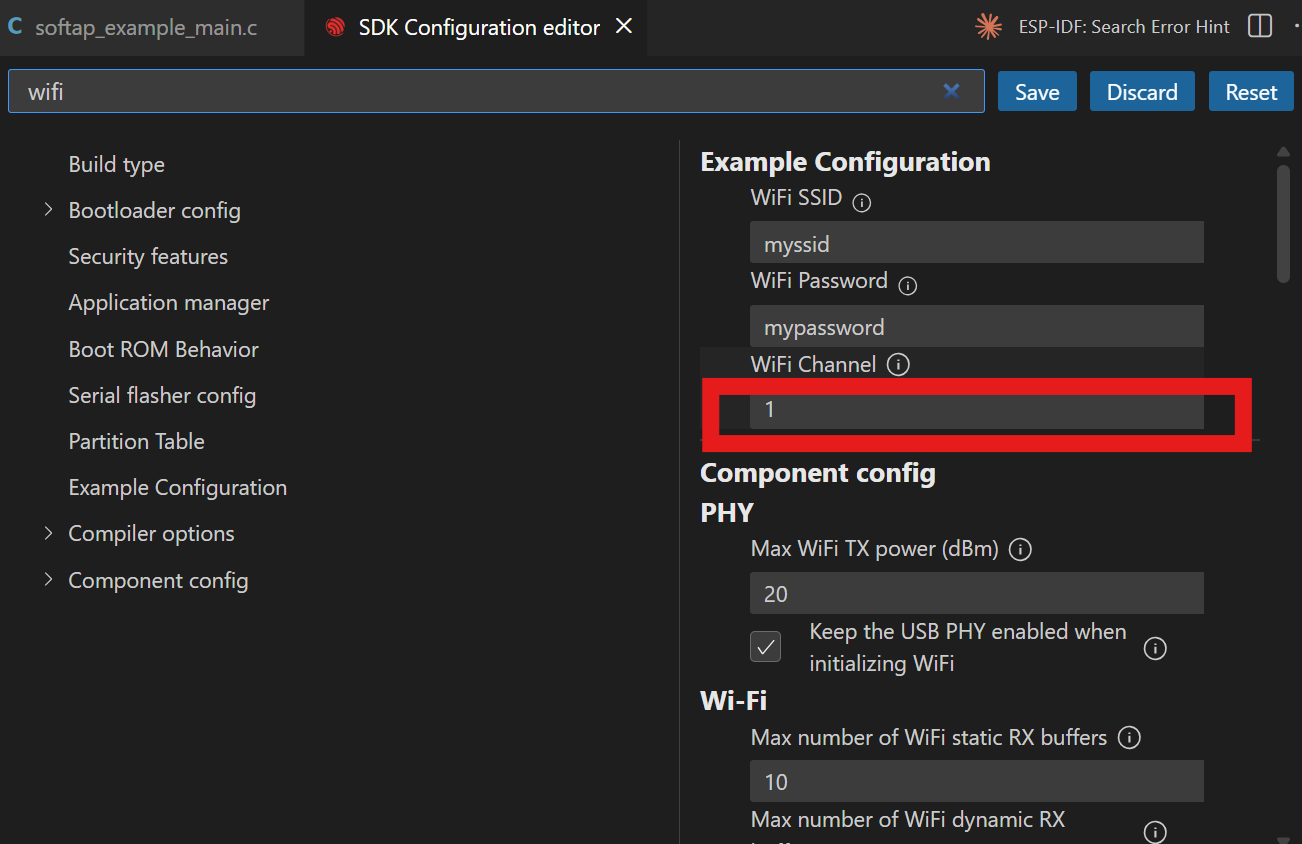
ESP-IDF: SDK Configuration Editor (Menuconfig). - Search for WiFi settings and set the WiFi channel. Use channel
1unless the TA assigns another channel.
You can also use the gear icon in the ESP-IDF toolbar to open configuration tools.

- Run
ESP-IDF: Build, Flash and Start a Monitor on Your Device. - Record the SoftAP MAC address and channel from the monitor output.
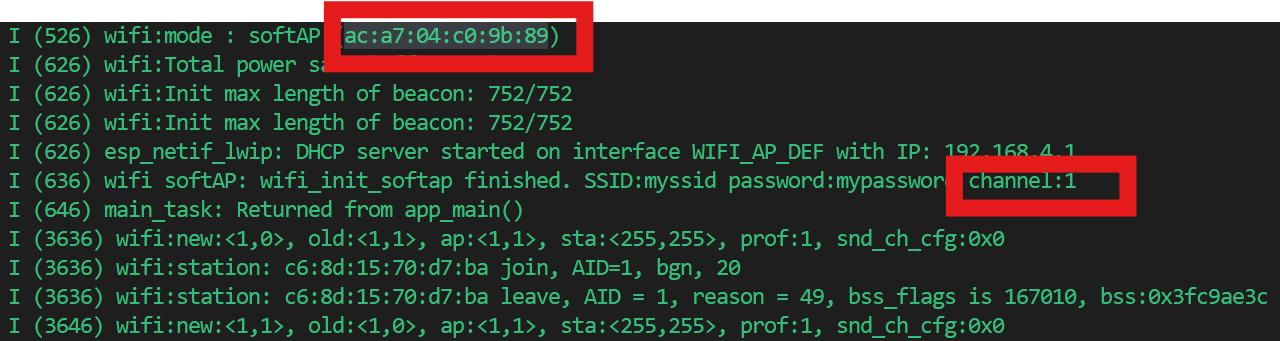
Record:
| Item | Value |
|---|---|
| SoftAP serial port | |
| SoftAP MAC address | |
| WiFi channel |
After the SoftAP is running, it can be powered from a USB power adapter.
SoftAP verification: use a phone or laptop to scan for the SoftAP SSID. You do not need to connect to the internet through it. Just confirm that the SSID appears and record the channel shown in the monitor output.
3:15-3:40 PM - Configure or Verify the Injector Board
The injector board sends spoofed 802.11 frames to create packets that the sniffer can capture.
- Open the
injector/folder in VS Code. - Connect the board labeled
injector. - Open
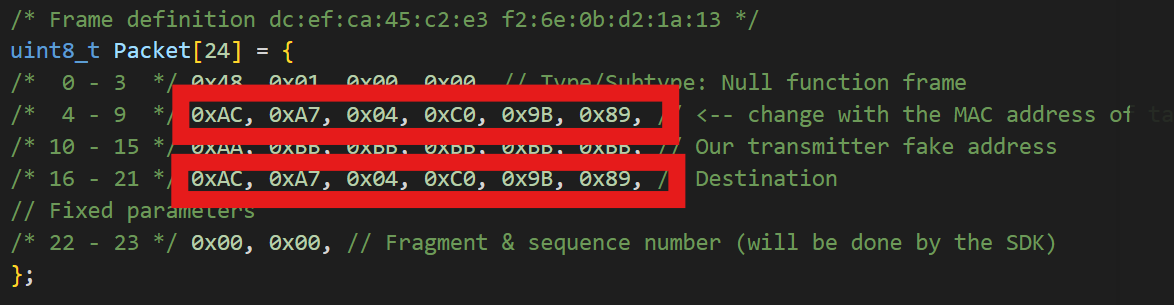
main/injector.c. - Set bytes
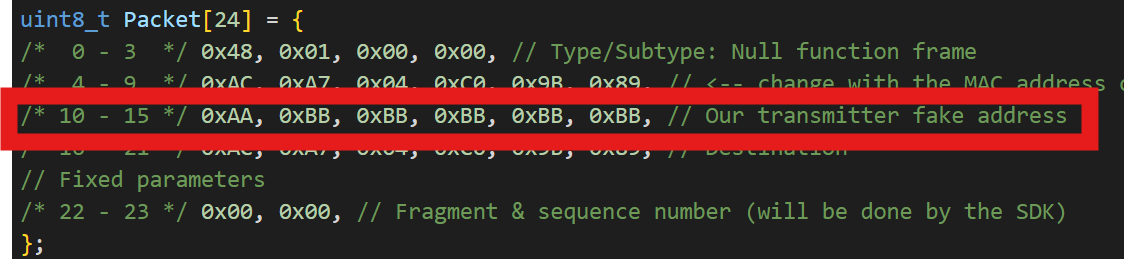
4-9and16-21in the packet to the SoftAP MAC address.
- Set bytes
10-15to a fake transmitter MAC address. Use a unique value for your group and write it down.
- Set the injector WiFi channel to the same channel as the SoftAP:
ESP_ERROR_CHECK(esp_wifi_set_channel(YOUR_CHANNEL, 0));
- Run
ESP-IDF: Build, Flash and Start a Monitor on Your Device.
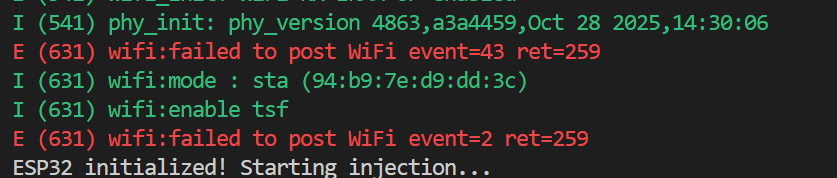
Expected injector output includes Starting injection....
Record:
| Item | Value |
|---|---|
| Injector serial port | |
| Injector fake MAC address | |
| Injector channel |
3:40-4:05 PM - Configure or Verify the Sniffer Board
The sniffer board listens on the same channel and streams CSI reports over USB serial.
- Open the
sniffer/folder in VS Code. - Connect the board labeled
sniffer. - Open
main/sniffer.c. - Set the injector fake MAC address:
#define INJECTOR_SPOOFED_MAC "AA:BB:BB:BB:BB:BB"
- Set the sniffer channel to the same channel:
ESP_ERROR_CHECK(esp_wifi_set_channel(YOUR_CHANNEL, 0));
- Run
ESP-IDF: Build, Flash and Start a Monitor on Your Device. - Confirm that the monitor prints CSI lines with timestamp, RSSI, address, and many integer CSI values.

Record:
| Item | Value |
|---|---|
| Sniffer serial port | |
| Sniffer listening MAC filter | |
| Sniffer channel |
Checkpoint: show the TA one live CSI line before moving on.
4:05-4:25 PM - Live CSI Visualization
Run the live CSI plot from the repository root:
python tools/plot_csi_serial.py --port SNIFFER_PORT --baud 115200
Replace SNIFFER_PORT with your sniffer serial port.
Observe:
- heatmap: subcarrier index vs. time;
- selected subcarrier amplitude over time;
- RSSI in the status line.
Try these scenes:
| Scene | What to do |
|---|---|
| static | Keep the injector-sniffer area empty and still. |
| walk | Walk through the link path. |
| wave | Wave one arm near the link path. |
Question: which subcarriers visibly change when someone moves?
Some subcarriers may look zero, invalid, or almost static. This is expected. The CSI buffer includes values from different long training fields, and the useful subcarrier range depends on packet type, bandwidth, and driver configuration. Some indices can also be guard/DC/pilot-related positions or invalid hardware words. Focus your detector on the subcarriers that respond clearly to motion instead of assuming every index is equally useful.
Useful reading:
4:25-4:50 PM - Presence Detection Coding Task
Open:
tools/csi_presence_detect.py
Complete MotionDetector.update().
The intended logic is:
- Append the newest CSI amplitude vector to
self.history. - Wait until at least two vectors are available.
- Stack recent vectors into a matrix.
- Compute variance over time for each subcarrier.
- Average those variances into one motion score.
- Return
motion = score > self.threshold.
Run live:
python tools/csi_presence_detect.py --port SNIFFER_PORT --threshold 2.0 --window-size 20 --log present.txt
You can also test without hardware:
python tools/csi_presence_detect.py --demo-signal
Experiment:
- lower the threshold and watch for false positives;
- raise the threshold and watch for missed motion;
- change
--window-sizeand observe latency vs. stability.
4:50-5:00 PM - Checkoff and Discussion
Show the TA:
- SoftAP MAC address and channel.
- Injector fake MAC address.
- One live sniffer CSI line.
- Live CSI heatmap or demo-signal plot.
- Presence detector running with your completed
MotionDetector.update(). - One threshold/window setting that worked reasonably well.
Deliverables
Submit one short group note and add the link to the shared Google Sheet. Include:
- Board table: serial port, role, MAC address, and channel.
- Screenshot or photo of one live CSI line.
- Screenshot of the CSI visualization or demo signal.
- Your completed
MotionDetector.update()code. - Short answers:
- What changed in CSI when someone moved?
- What threshold did you choose?
- What caused false positives or false negatives?
- How would room layout or other WiFi traffic affect the result?
Troubleshooting
| Problem | Likely Cause | Fix |
|---|---|---|
| Board not visible as a serial port | Charge-only cable or missing USB driver | Try a known data cable; check Device Manager or /dev/cu.*; ask a TA. |
| Flash fails | Wrong target, wrong port, or board not in bootloader mode | Select the right port; hold BOOT during connect if needed; ask a TA before erasing. |
| Sniffer prints no CSI | MAC filter or channel mismatch | Confirm injector fake MAC and channel match the sniffer configuration. |
| Live plot opens but stays blank | Wrong serial port or sniffer not streaming | Recheck SNIFFER_PORT and monitor output. |
| PyQt/PyQtGraph error | Python packages missing | Activate cosmos-ds and run python -m pip install -r tools/requirements.txt. |
| Detector never triggers | Threshold too high or too little motion near link | Lower --threshold, move closer to the injector-sniffer path, or increase motion. |
| Detector always triggers | Threshold too low or noisy environment | Raise --threshold, reduce nearby movement, or reposition boards. |
Optional Extension
If time remains, try one or more of these self-directed extensions.
Try Wireshark Yourself
Install Wireshark on your own computer and open the provided packet capture:
wireshark_example.pcap
Inspect a few packets and identify the source MAC address, destination MAC address, frame type, and any visible signal or channel information. Compare what Wireshark shows with what the ESP32 sniffer prints in the serial monitor.
Try More ESP32 or Core2 Examples
Use the ESP-IDF extension to try another official ESP-IDF example project, such as an example related to WiFi, GPIO, timers, or UART. Start from the VS Code command palette with ESP-IDF: New Project or ESP-IDF: Show Examples Projects.
For the M5Stack Core2 module only, you may also explore M5Burner and try one of the Core2 demos. Do not use M5Burner on the ESP32-CAM or ESP32-C3-Mini boards.
Look for Breathing in CSI
Record a 60-second CSI log with one person sitting still near the injector-sniffer path. Breathing creates a much smaller CSI change than walking or waving, so the signal may be weak.
Suggested analysis:
- Choose one or a few subcarriers that responded clearly during the motion experiment.
- Plot CSI amplitude over time for those subcarriers.
- Compare an empty-room recording with a still-person recording.
- Try a moving average, detrending, or background subtraction step.
- Look for slow periodic changes that could correspond to breathing.
Write down whether the result looks stable or noisy. If you cannot see breathing clearly, explain what may make the measurement difficult, such as body position, board placement, nearby motion, reflections, or WiFi interference.
Read a WiFi Sensing Paper
Read or skim WiSee: Whole-Home Gesture Recognition Using Wireless Signals. Focus on the introduction and system overview first.
Questions to think about:
- What signal changes does WiSee use for sensing?
- How is its hardware and sensing setup different from this lab?
- What assumptions does the paper make about the environment or users?
- What would be hard to reproduce in a short classroom lab?